See your whole camp in numbers, without exporting a single one

The view you were missing, built on the data you already have

Every director asks the same questions: which sessions will miss their minimum, which are over capacity, where enrollment is trending, what's filling and what isn't. Answering them usually means an export, a spreadsheet, and doing it all again on Thursday. CampOrganizer's analytics removes that work. Your sessions, enrollments, capacity, and statuses already live on the platform, so it doesn't need an export to answer. It already knows, and it shows you. The numbers live where the work happens and update as your camp operates. And analytics here is decision-first. A report doesn't just show a chart; it surfaces the specific sessions and rows that need attention right now, so you leave it knowing what to do next, not just what happened. Analytics is not a wall of dashboards. It's your camp's own data, turned into the next decision.

Read it, slice it, compare it, act on it

  • Reports built into the platform The numbers live inside CampOrganizer and update as your camp runs, no export, no spreadsheet, no reconciling two versions of the truth.
  • One consistent report shape Every report reads the same way: a headline summary, breakdowns beneath it, a worklist of what needs attention, and filters. Once your team can read one, they can read them all.
  • Slice and filter to the view you need Break a metric down by session, status, program, or over time, and narrow to a year, a program, or a single session, the same report answers "how are we doing overall" and "which session, exactly".
  • Compare in the time frame camps actually run in See trends across the season and measure against your own targets, minimums, capacity, with time aligned to how camps operate: the weeks before a session starts, not an arbitrary calendar month.
  • Decision-first worklists Reports surface the exact sessions and rows that need action now, analytics you act on, not just read.
  • One definition of every number "Confirmed participants" means the same thing on every report, for every team. No more arguing about whose spreadsheet is right, the metric is defined once and reused everywhere.
  • A growing library of reports Analytics starts with enrollment and capacity and expands outward, so more of your recurring questions are answered out of the box over time.
  • Read-only by design Analytics reports on your data and never changes it. Exploring the numbers is always safe.

A camp runs a handful of sessions a year. Each one is a lesson, if you can read it.

Before the session

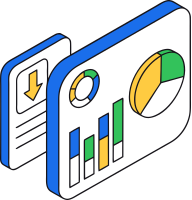
Enrollment pace, capacity, readiness, and what's at risk of missing its minimum, early enough to act, not to regret.

During the session

The numbers move with the camp, so what needs attention surfaces while the outcome can still be changed.

After the session

The review runs on evidence instead of the strongest memory in the room: what happened, where it differed from plan, what to change.

Into the next one

Season over season, the organization keeps its history, and a change you made can be measured against the next comparable session, not just felt.
From running your camp to knowing what to do next

1

Run your camp on the platform

Registration, sessions, capacity, and operations already generate the data, no separate data entry for analytics.

2

Open a report inside CampOrganizer

Read the headline summary for the whole camp, or your current filter.

3

Break it down

Slice by session, status, program, or over time.

4

Put it in context

Compare against your targets and across the season to see what's really happening.

5

Act on the worklist

Work the specific sessions and rows the report flags.

6

Come back as the numbers move

The report updates as your camp operates, no Thursday re-export.

The same numbers, the right view for each leader

Owners and directors

See the whole camp at a glance, spot what's at risk, and make season decisions from live numbers instead of a stale export.

Operations and administrators

Work the worklists, follow the sessions that need attention, and filter to the exact slice you own.

Session Coordinators

Focus on their sessions, readiness, enrollment, what needs action before and during delivery.
Registration teams

See where families are progressing, where they stall, and where follow-up will actually move the number.

Program leaders

Compare programs and sessions over time to understand what fills, what lags, and where to focus.


Analytics is a view of the platform, not a second system

From your operations

sessions, enrollments, capacity, and statuses become reports without separate data entry.

Live with the work

as the camp operates, the numbers move with it, a report is current, not last week's export.

Same access model

who sees analytics follows the same camp-scoped authorization as the rest of the platform.

One source of truth

the numbers in a report are the same records driving operations, leadership and the ground floor look at one reality.

Beside the Report Builder

analytics tells you which sessions need attention; the Report Builder produces the governed, record-level report for acting on them.

Your camp's numbers, and only your camp's

  • Your camp only, enforced by the platform A camp only ever sees its own numbers. Isolation is enforced on the server, not by a filter a user could remove or a setting someone could misconfigure.
  • Aggregated, not a raw data dump Analytics works on aggregated operational facts, session counts, capacity, statuses, not raw personal records. Where a number points at a problem, record-level action happens in the permissioned operational workflows, not in an analytical export. Insight never costs a spill of sensitive data.
  • Self-hosted on EU infrastructure The analytics stack runs on CampOrganizer's own EU infrastructure with no third-party analytics processor. Your camp's data is not handed to an outside vendor to produce a report.
  • Certified security management Data is encrypted in transit and at rest, and CampOrganizer's information security management system is certified according to ISO/IEC 27001:2022 by an independent certification body, covering both standard and white-label deployments. The certificate and certified scope are published on the Trust page.

Decisions from live numbers, not a spreadsheet from last Tuesday

The view, not just the data

You already have the data; analytics finally gives you the view, and points at what to do about it.

No exports, no reconciling

The numbers live inside the platform and move with your camp. No export to run, no two versions of the truth.

Context, not just figures

Breakdowns, trends, and targets put every number in context, "we're at 60 percent" becomes "these three sessions are at risk".
Reviews run on evidence

The post-season conversation compares plan, execution, and results, instead of relying on the strongest memory in the room.

Only ever your camp

Per-camp isolation and aggregated data mean insight without your information leaking to anyone else, or anyone else's reaching you.

Knowledge that stays with the camp

Facilities can be copied; activities can be copied; even pricing can be copied. What's hard to copy is knowing how your own organization actually performs, and that knowledge now survives staff turnover instead of leaving in someone's head.

Frequently asked questions about camp analytics

What is CampOrganizer's analytics?
The analytics layer built into CampOrganizer. It turns the data your camp already generates, sessions, enrollments, capacity, statuses, into decision-first reports read inside the platform.
Do I have to export data to use it?
No. The numbers live inside CampOrganizer and update as your camp runs. No export, no spreadsheet.
How can I break the numbers down?
Every report slices by session, status, program, or over time, and filters by year, program, or session, from the whole camp to a single session in a couple of clicks.
Can I compare over time?
Yes. Reports show trends across the season and measure against your own targets, such as minimum enrollment and capacity, so a number always comes with context.
Who can see analytics?
Analytics follows the same camp-scoped access as the rest of the platform: the leadership roles entitled to a camp, and each camp sees only its own numbers.
Is my camp's data kept separate from other camps?
Yes. Per-camp isolation is enforced by the platform on the server, and analytics works on aggregated operational data, not a raw dump of personal records.
Does analytics change my camp data?
No. Reports are read-only, they report on your data and never modify it.
How is this different from the Report Builder?
Analytics gives aggregate insight: trends, comparisons, and the sessions that need attention. The Report Builder produces governed, record-level reports, the allergy list, the rooming plan, as permissioned, point-in-time snapshots. They work together: one tells you where to look, the other hands the right team the list.
How many reports are there?
Analytics starts with enrollment and capacity and expands outward. The library keeps growing, so more of your recurring questions get answered out of the box over time.
Will analytics improve my camp by itself?
No, and we won't pretend otherwise. What it does is shorten the loop between spotting a problem, making a change, and measuring the result. Organizations that run that loop consistently learn faster than those managing from memory and annual reviews.

See your season in numbers you can act on

In a 30-minute demo, we'll show how CampOrganizer turns the data your camp already generates into decision-first reports, sliced the way you run, compared over time, and scoped to your camp alone.

© 2026 CampOrganizer. All rights reserved.